The 2018 Update on Clarke’s Sustainability Journey


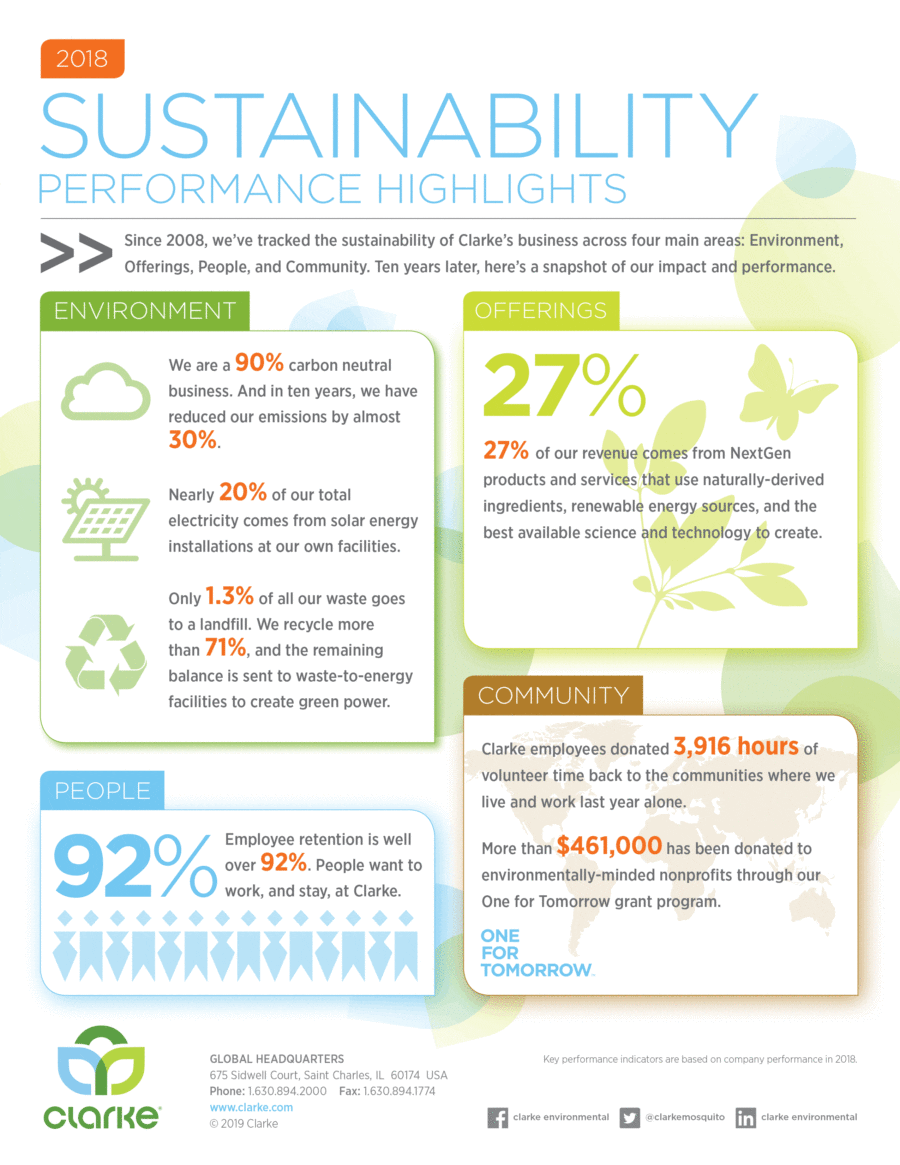
To share our 2018 Sustainability Performance, we decided to depart from producing a full report and instead, are showcasing our performance in an infographic that hits the highlights of our program achievements. The poster provides updates on our performance in our key Sustainability focus areas in a format that is visually impactful and a nice change of pace from our full-length report.
In 2018, we hit our 10-year mark in tracking performance to improve our Environmental, Offering, People, and Community impacts. It is quite remarkable to reflect back on where we were a decade ago when we first began to explore a more Sustainable Clarke. I don’t know any of us could have imagined that in 10 years we would:
As with any worthwhile journey, we’ve faced some challenges. Macroeconomic trends in the waste industry have certainly impacted our recycling performance – which peaked at 84% in 2015 and dropped to just 71.3% in 2018. Although it has become more difficult to find ways to recycle some of the materials in our waste stream, we remain committed to advancing the processes, policies and educational programs that allow us to reduce, reuse, recycle, and prevent our waste from ending up in landfills.
Acknowledging these challenges, in addition to celebrating our achievements, is probably the most important lesson that we have learned on our sustainability journey. Sustainability isn’t an achievement. It isn’t something that is “done.” It is a constant commitment to challenge our thinking and innovate toward a more sustainable and flourishing world.
We look forward to hearing what you think. Download the full Infographic PDF here.